This info is for Premium Forum members and those who want to join. To join or renew, subscribe on this website. Support my work here or let me know your payment method. Thanks.

Pivot Points

Basic terms and concepts of technical analysis.
Post Reply
User avatar
igorad
Site Admin
Posts: 314
Joined: Mon Jun 06, 2022 8:19 am
Location: Ukraine

Pivot Points

Wilder(or Floor) Points

There are many different ways to build Pivot Points, but the most famous are the Wilder(or Floor) Points, which he first described in his book New Concepts in Technical Trading Systems(1978).

Wilder_p71.png
Wilder_p72.png

Over time, the level names began to look different compared to the original ones. Thus, now they are named and calculated like this:
  • Pivot point P= (High+Low+Close)/3
  • Resistance 1 R1=(P×2)−Low
  • Resistance 2 R2=P+(High−Low)
  • Support 1 S1=(P×2)−High
  • Support 2 S2=P−(High−Low)

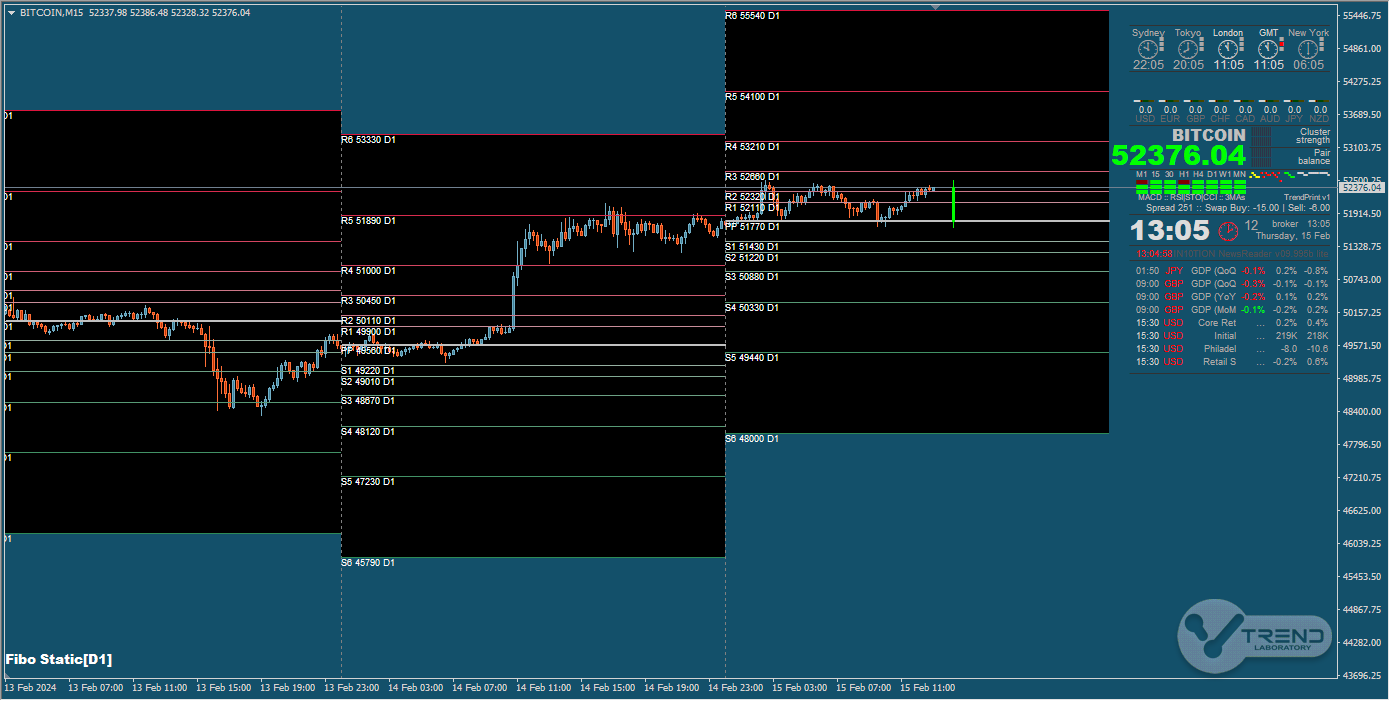
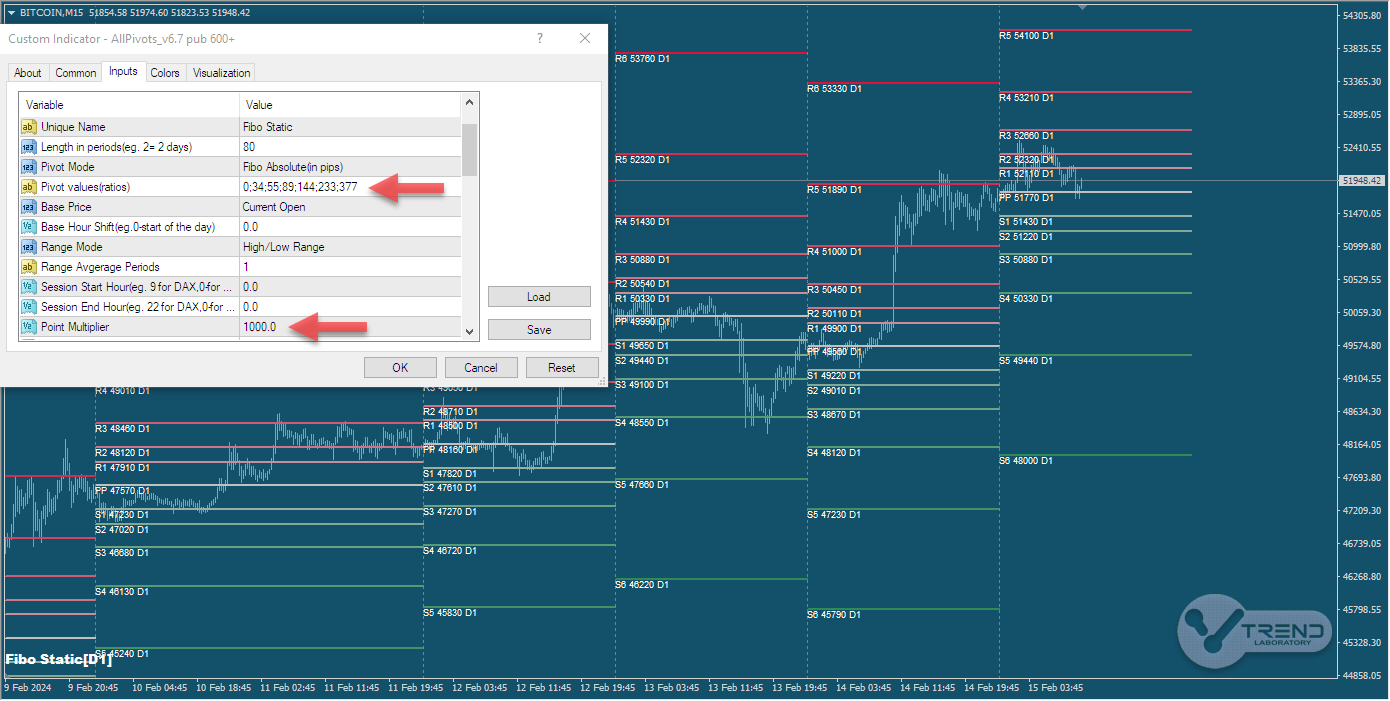
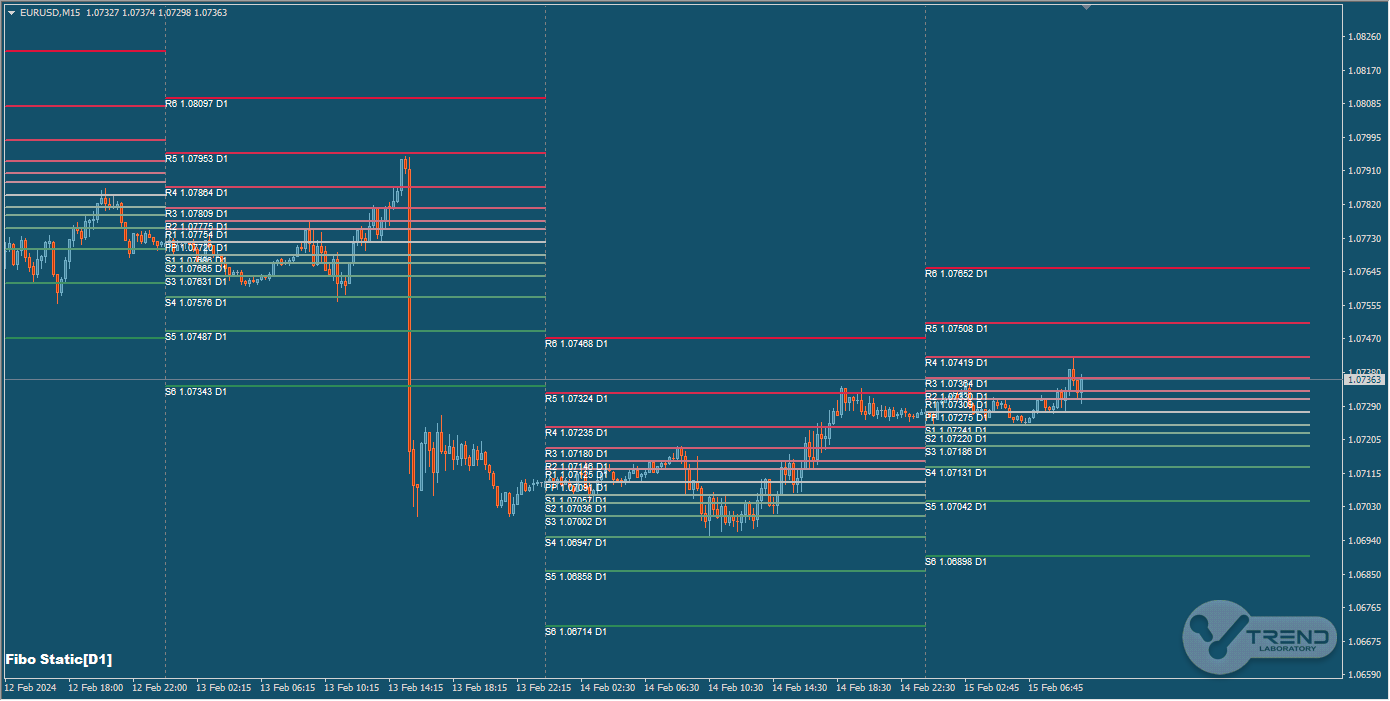
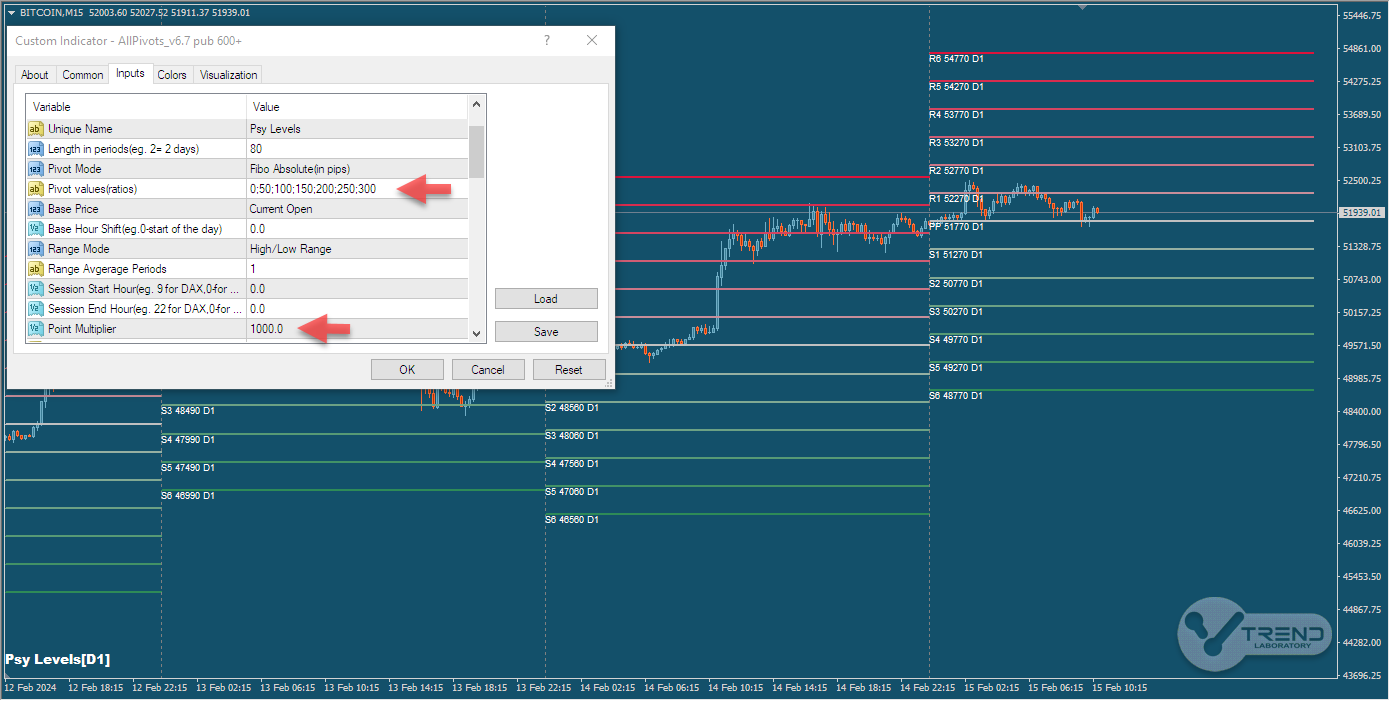
Relatively recently, I discovered a formula that allows to calculate any number of R & S points. This formula is implemented in the AllPivots indicator.

AllPivots+In10tion_light.png


The Floor Trader Pivots for Tradestation you can find here.
You do not have the required permissions to view the files attached to this post.
Last edited by igorad on Thu Oct 06, 2022 9:16 am, edited 5 times in total.
User avatar
igorad
Site Admin
Posts: 314
Joined: Mon Jun 06, 2022 8:19 am
Location: Ukraine

Camarilla Points

Camarilla Points

Camarilla pivot points were discovered in 1989 by Nick Scott, a successful bond trader. The basic thesis for this strategy is a common one: That price, as most time series, has a tendency to revert to its mean, right up until the point it doesn’t.

As compared to classic pivots where traders look for Resistance 1 and Support 1 levels, the most important levels for the Camarilla pivot point variation are the third and fourth levels.

Camarilla pivot point calculations are rather straightforward. We need to input the previous day’s open, high, low and close. The formulas for each resistance and support level are:
  • H4 = Close + (High – Low) * 1.1/2
  • H3 = Close + (High – Low) * 1.1/4
  • H2 = Close + (High – Low) * 1.1/6
  • H1 = Close + (High – Low) * 1.1/12
  • L1 = Close – (High – Low) * 1.1/12
  • L2 = Close – (High – Low) * 1.1/6
  • L3 = Close – (High – Low) * 1.1/4
  • L4 = Close – (High – Low) * 1.1/2
The calculation for further resistance and support levels varies from this norm. These levels can come into play during strong trend moves, so it’s important to understand how to identify them. For example, R5, R6, S5 and S6 are calculated as follows:
  • H5 = R4 + 1.168 * (R4 – R3)
  • H6 = (High/Low) * Close
  • L5 = S4 – 1.168 * (S3 – S4)
  • L6 = Close – (R6 – Close)

AllPivots_Camarilla_light.png


There is a lot of research on these levels, including trading strategies using them. For example, you can find the indicator and strategy described in the S.Bobrovsky's article here.
You do not have the required permissions to view the files attached to this post.
User avatar
igorad
Site Admin
Posts: 314
Joined: Mon Jun 06, 2022 8:19 am
Location: Ukraine

Fibonacci Pivot Points

Fibonacci Pivot Points


Just like Standard Pivot Points, Fibonacci Pivot Points also start with a Base Pivot Point. The main difference is that they also incorporate Fibonacci levels in their calculations.

Most traders use 38.2%, 61.8% and 100% retracements in their calculations and, therefore, Fibonacci Pivot Points represent three support and three resistance levels.

The main logic behind Fibonacci Pivot Points is that many traders love using Fibonacci Ratios.

Both Pivot Points and Fibonacci Ratios are used to find support and resistance levels.

With so many traders using both tools in their analysis, they can easily become self-fulfilling.

The Base Pivot Point, support and resistance levels for Fibonacci Pivot Points are calculated as follows:
  • Pivot Point (P) = (High + Low + Close)/3
  • Support 1 (S1) = P – {0.382 * (High – Low)}
  • Support 2 (S2) = P – {0.618 * (High – Low)}
  • Support 3 (S3) = P - {1 * (High - Low)}
  • Resistance 1 (R1) = P + {0.382 * (High – Low)}
  • Resistance 2 (R2) = P + {0.618 * (High – Low)}
  • Resistance 3 (R3) = P + {1 * (High – Low)}
AllPivots_v6.6 Fibo.png

The Fibo Pivot Points for Tradestation you can find here.
You do not have the required permissions to view the files attached to this post.
User avatar
igorad
Site Admin
Posts: 314
Joined: Mon Jun 06, 2022 8:19 am
Location: Ukraine

Demark Pivot Points

Demark Pivot Points


DeMark considers the relationship between the current bar’s open and close to be more significant than the comparison of the current close to the previous bar’s close.
This study can be applied to any market or time frame, from ticks to years, but DeMark’s preference, and my own as well, is to use it for daily price bars.

The Three Possible Scenarios and How to Calculate Them
  • If the current day’s closing price is above the current day’s opening price, then X =((2 *current day’s high + current day’s low + current day’s close)/2).
  • If the current day’s closing price is below the current day’s opening price, then X =((current day’s high + 2*current day’s low + current day’s close)/2).
  • If the current day’s closing price is equal the current day’s opening price, then X =((current day’s high + current day’s low + 2* current day’s close)/2).
To calculate the expected low for the following day, Subtract the current day’s high from X.
To derive the following day’s projected high, Subtract the current day’s low from X.

AllPivots_v6.6 Demark.png
Also you can read more here about these pivots.

Important note.
I plan to remove these pivots from the Pivots' List because this is one more variation of the Floor Pivots. But I'll add a Demark Weighted Price to the Price List also.
So these pivots you could get using the Floor Pivots and the mentioned price.
You do not have the required permissions to view the files attached to this post.
User avatar
igorad
Site Admin
Posts: 314
Joined: Mon Jun 06, 2022 8:19 am
Location: Ukraine

Fibonacci Static Pivots

Fibonacci Static Pivots

I first encountered this type of Pivots in the IN10TION News Reader indicator where they are set by a sequence of Fibonacci numbers +/- {34, 55, 89, 144, 233, 377} in pips relative to the Daily Open.


Image


However, the AllPivots indicator allows you to use other numbers from the Fibonacci sequence, such as 21, 34, 55, 89, 144, 233, 377, 610, etc.
It is also important to choose the right Point Multiplier value for these Pivots, especially for quotes with a large integer part (e.g. indices and cryptocurrencies).

Image


Image


In addition, you can build so-called Psychological Levels(PsyLevels) relative to the rounded value of Daily Open(or Current Open) of the period using for example the following values 50, 100, 150, 200, 250, 300, 350, 400, 450, 500.

Image
You do not have the required permissions to view the files attached to this post.
Post Reply